
A challenge to designing effective STEM programs is that they address very large, complex goals, such as increasing the numbers of underrepresented students in advanced technology fields.
To design the best possible programs to address such a large, complex goal, we need a large, complex understanding (from looking at the big picture). It’s like when medical researchers seek to develop a new cure–they need deep understanding of how medications interact with the body, other medications, and how they will affect the patient based on their age and medical history.
A new method, Integrative Propositional Analysis (IPA), lets us visualize and assess information gained from evaluations. At the 2015 American Evaluation Association conference, we demonstrated how to use the method to integrate findings from the PAC-Involved (Physics, Astronomy, Cosmology) evaluation into a strategic knowledge map.
A strategic knowledge map supports program design and evaluation in many ways.
Measures understanding gained.
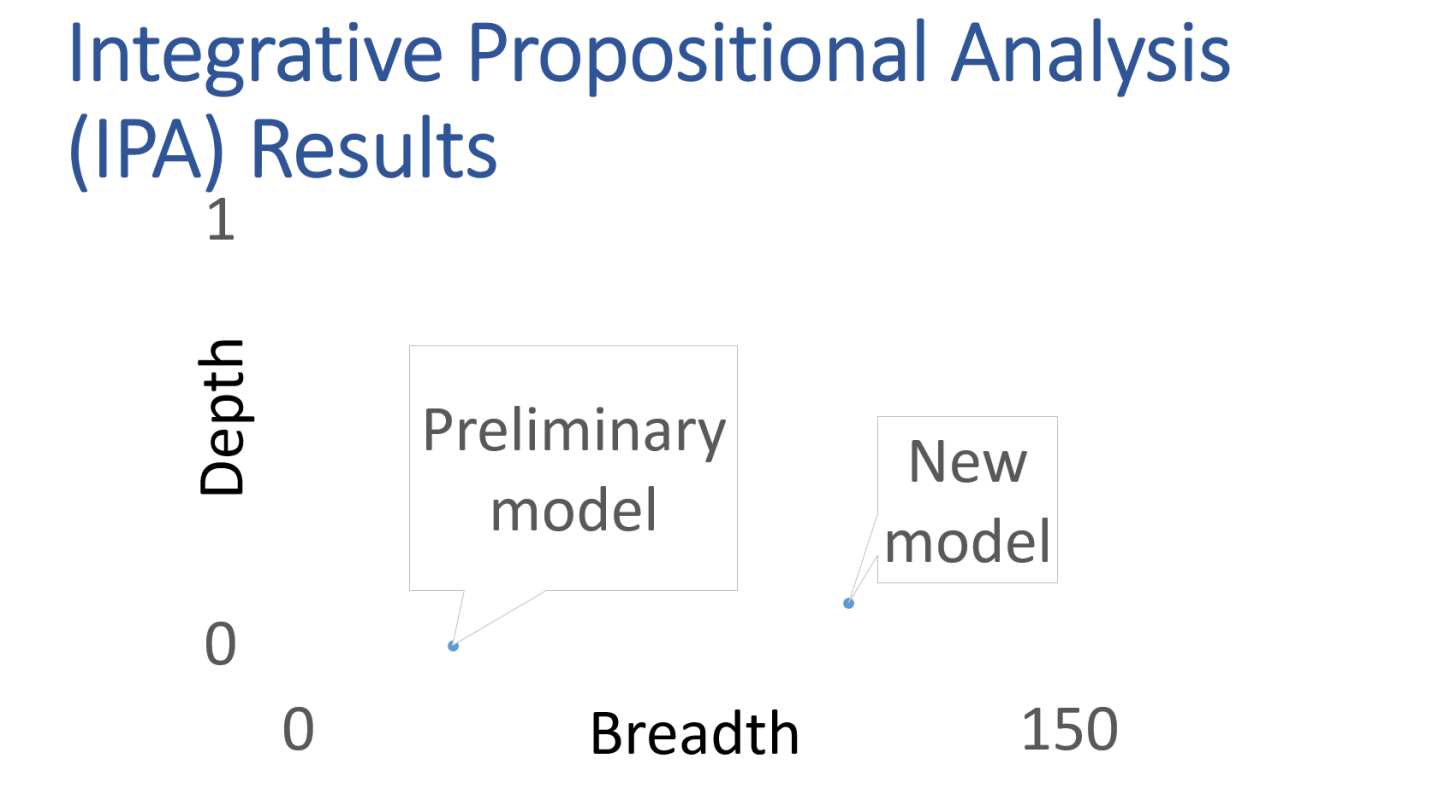
The map is an alternative logic model format that provides broader and deeper understanding than usual logic model approaches. Unlike other modeling techniques, IPA lets us quantitatively assess information gained. Results showed that the new map incorporating findings from the PAC-Involved evaluation had much greater breadth and depth than the original logic model. This indicates increased understanding of the program, its operating environment, how they work together, and options for action.
Shows what parts of our program model (map) are better understood.
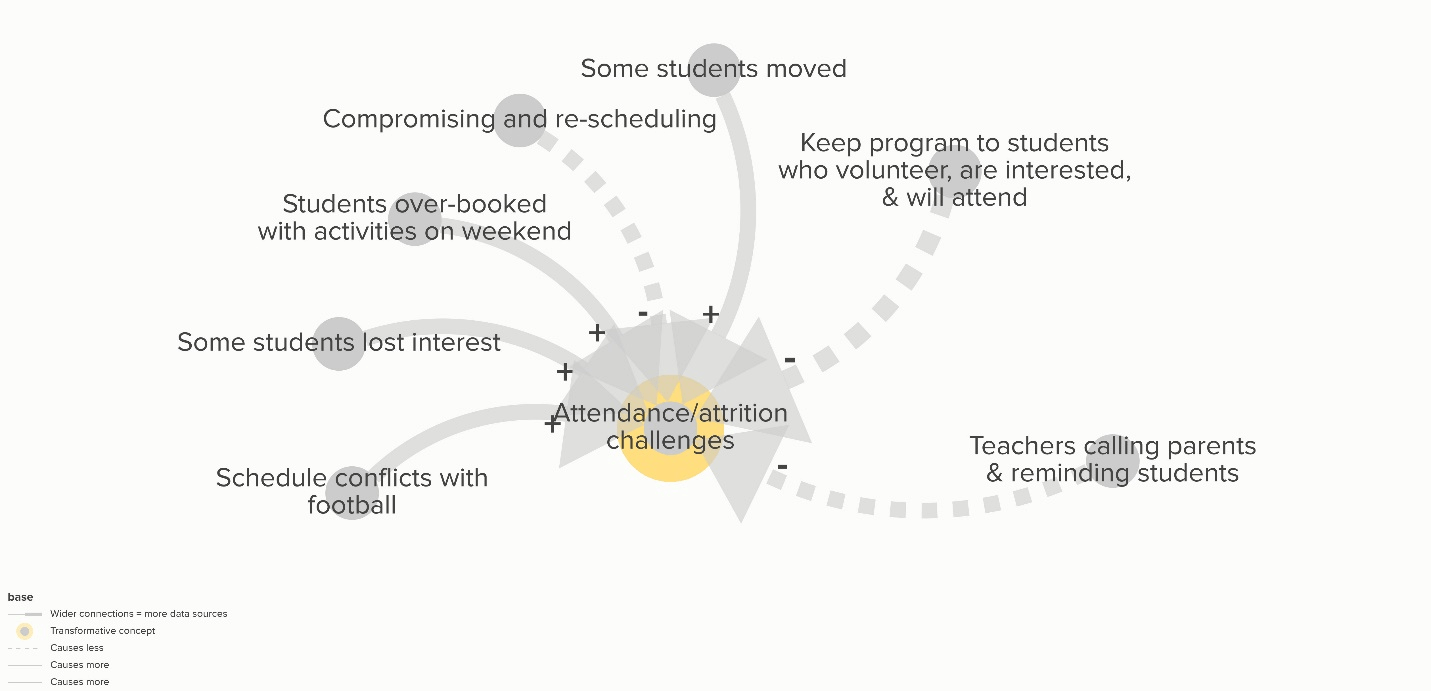
In the figure below, the yellow shadow around the concept “Attendance/attrition challenges” indicates that this concept is better understood. We better understand something when it has multiple causal arrows pointing to it—like when we have a map that shows multiple roads leading to each destination.
Shows what parts of the map are most evidence supported.
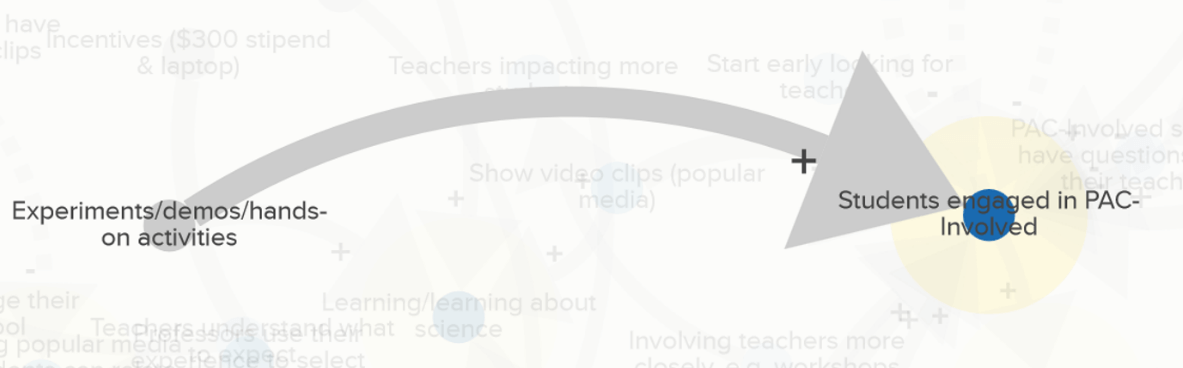
We have more confidence in causal links that are supported by data from multiple sources. The thick arrow below shows a relationship that many sources of evaluation data supported. All five evaluation data sources—the project team interviews, student focus group, review of student reflective journals, observation, and student surveys all provided evidence that more experiments/demos/hands-on activities caused students to be more engaged in PAC-Involved.
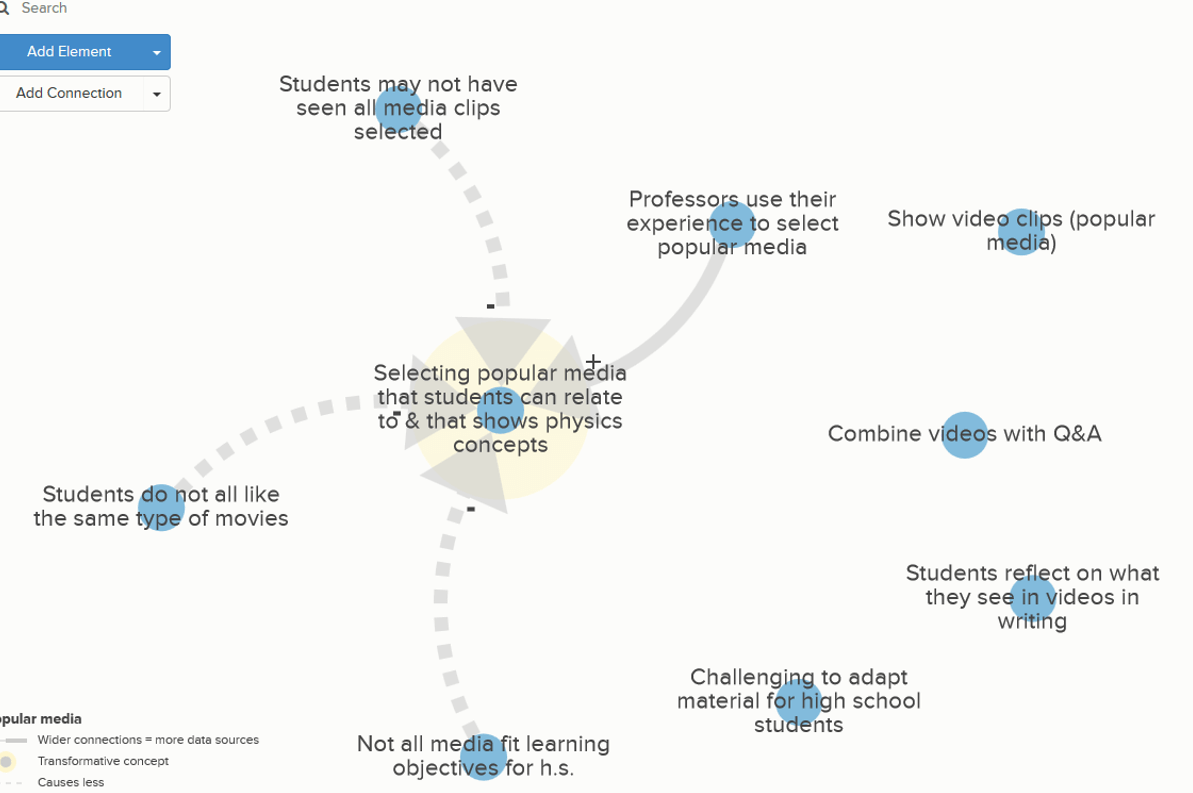
Shows the invisible.
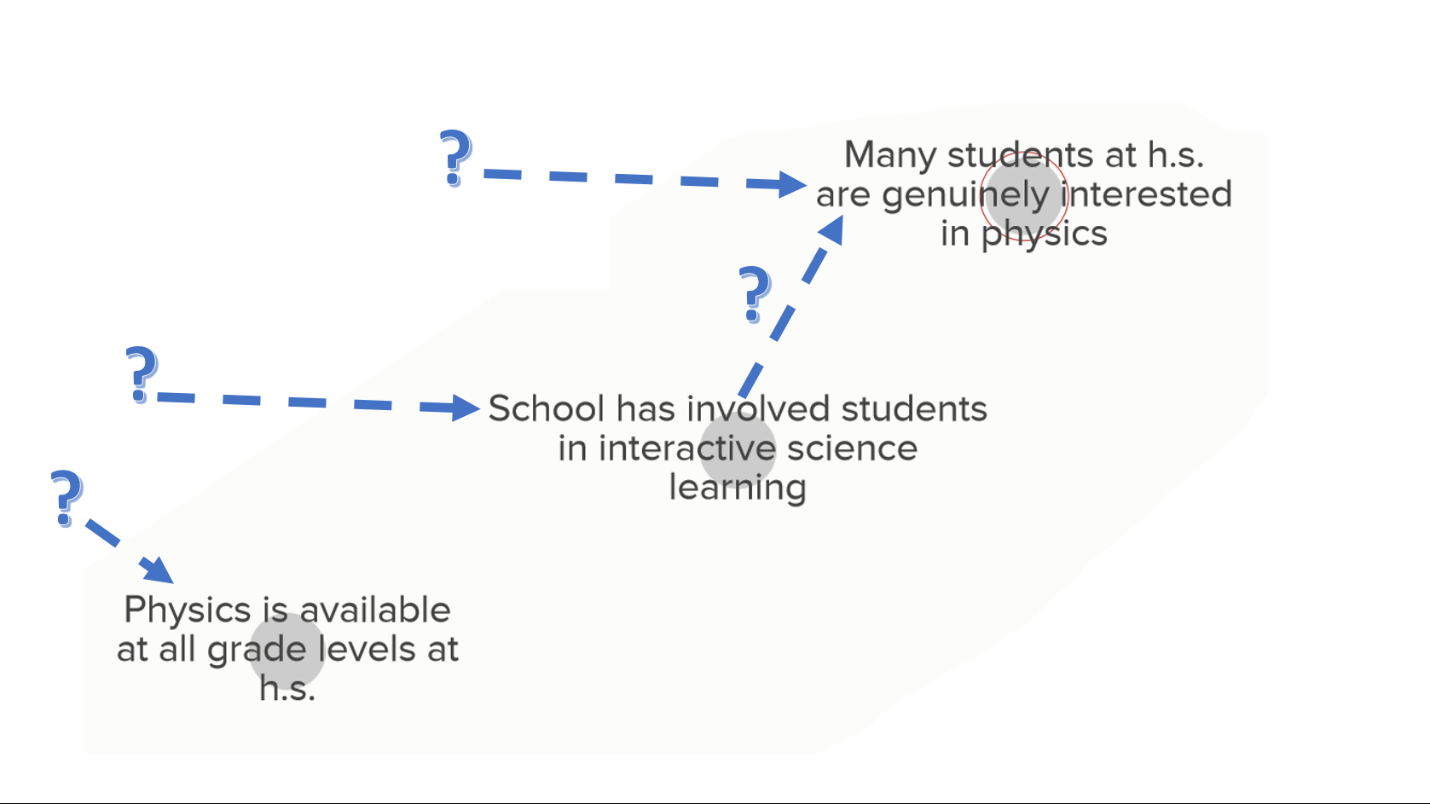
The map also helps us to “see the invisible.” If something does not have arrows pointing to it, we know that there is “something” that should be added to the map. This indicates that more research is needed to fill those “blank spots on the map” and improve our model.
Supports collaboration.
The integrated map can support collaboration among the project team. We can zoom in to look at what parts are relevant for action.
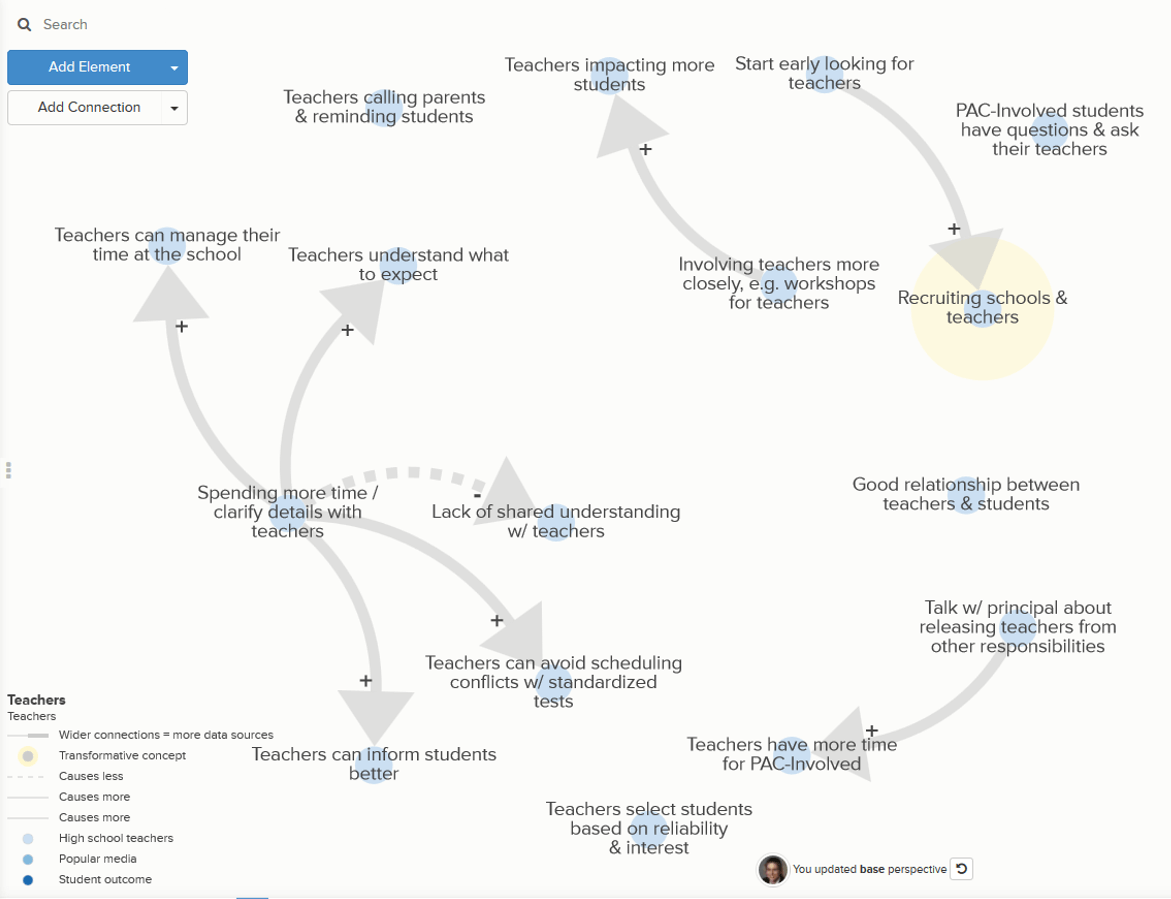
Supports strategic planning.
The integrated map also supports strategic planning. Solid arrows leading to our goals indicate things that help. Dotted lines show the challenges.
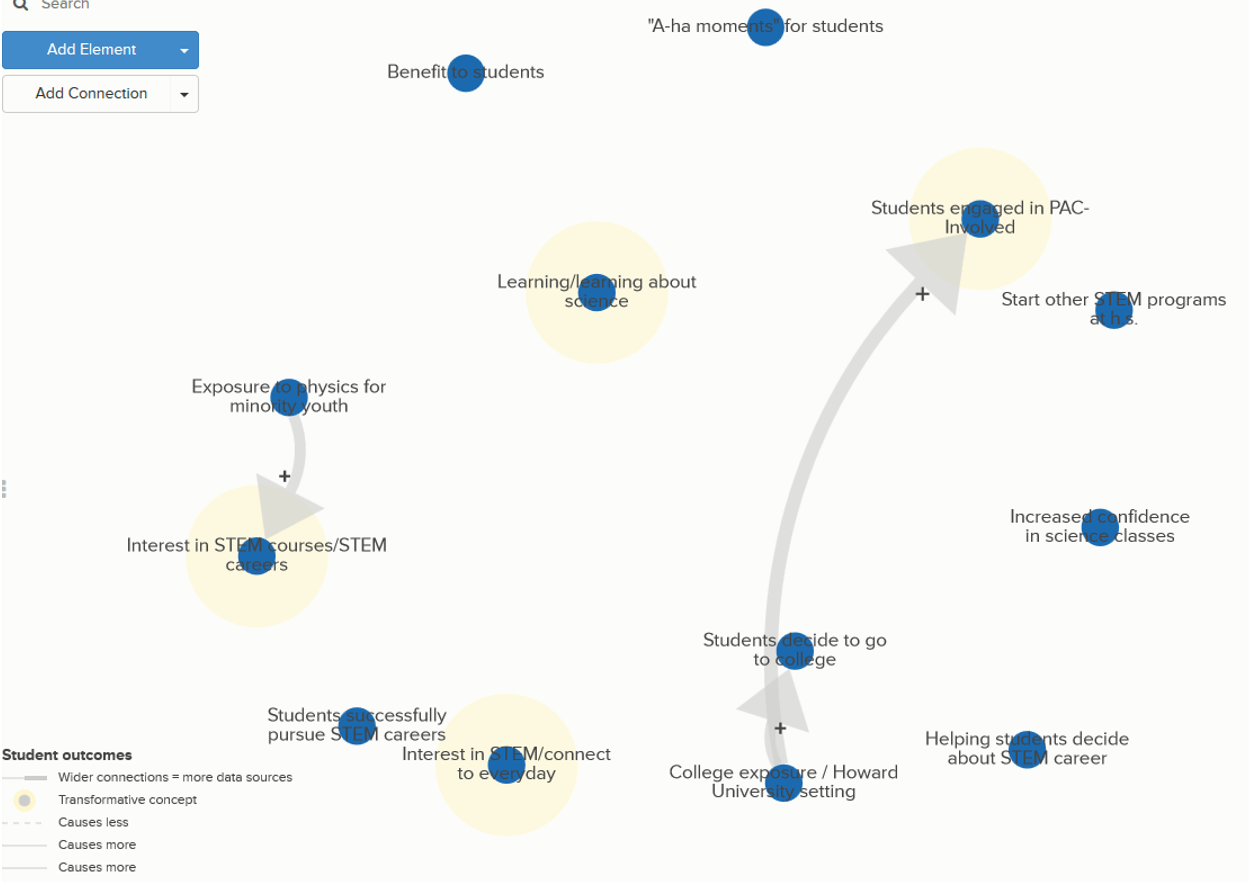
Clarifies short-term and long-term outcomes.
We can create customized map views to show concepts of interest, such as outcomes for students and connections between the outcomes.
We encourage you to add a Strategic Knowledge Map to your next evaluation. The evaluation team, project staff, students, and stakeholders will benefit tremendously.

Bernadette Wright
Director of Research and Evaluation, Meaningful Evidence, LLCDr. Bernadette Wright is the Director of Research & Evaluation at Meaningful Evidence, LLC, where she provides program evaluation and policy research for nonprofits and universities, using mixed-method evaluation and the innovative Integrative Propositional Analysis approach to integrating and improving theories. She specializes in STEM/education, health care/human services, and equity for underserved populations. She is a member of the American Evaluation Association (AEA) and currently serves as Webmaster of the AEA STEM Education and Training Topical Interest Group. She earned her PhD. in public policy/program evaluation from the University of Maryland in 2002.

Except where noted, all content on this website is licensed under a Creative Commons Attribution-NonCommercial-ShareAlike 4.0 International License.